
A clear guide to load management, phase rotation, and smart charging
Static vs dynamic load management, why getting phase rotation right is critical for efficient power usage, and how OCPP 1.6 smart charging profiles actually work

As electric vehicle adoption accelerates globally, the complexity of managing EV charging infrastructure has grown exponentially. A single charging site that once supported a handful of vehicles now needs to orchestrate dozens of simultaneous charging sessions while respecting grid constraints, driver needs, and operational efficiency.
This article provides the foundational knowledge needed to understand the principles behind load management (or load balancing), how it differs from smart charging, which factors impact load balancing and smart charging, and why proper planning and documentation of phase rotation for AC charging networks is so important for an efficiently operating charging network. We’ll also look at how the tools the Open Charge Point Protocol (OCPP) provides to implement smart charging across your managed network of EV chargers.
Think of a charging network like an airport terminal. Without coordination, all planes would try to land simultaneously, overwhelming the runways. Similarly, without load management and smart charging, all EVs would draw maximum power the moment they connect, potentially overwhelming the electrical infrastructure. The protocols and techniques we’ll explore act as the air traffic control system for electrons.
Load management vs smart charging: what’s the difference?
While these terms are often used interchangeably, they represent distinct but complementary concepts in the EV charging ecosystem.
Load management (static and dynamic)
Load management focuses on distributing available electrical capacity across multiple charge points to prevent infrastructure overload. It operates at the site level, ensuring the total power drawn by all chargers never exceeds the capacity of the grid connection, building wiring, or upstream protection devices.
Static load management (SLM) allocates a fixed portion of available capacity to each charger based on predetermined rules. For example, a workplace car park with a 70kW grid connection installs ten 11kW three-phase chargers for employees. To guarantee all ten can operate simultaneously without tripping the supply, static load management limits each charger to just 7kW permanently – only 64% of its capability and the vehicles’ acceptance rate.
Consider what happens at 8am when only three employees have arrived and plugged in: under static load management, each still receives only 7kW, leaving 49kW of available capacity sitting idle. Those three vehicles could each be charging at their full 11kW (33kW total), completing their charges in two-thirds of the time. By 10am, when all ten vehicles are connected, the static allocation makes sense. But by 1pm, five vehicles have already reached 80% state of charge and their battery management systems have reduced acceptance to 3kW each. The static system continues reserving 7kW for each of those sessions, wasting 20kW that could accelerate charging for the remaining vehicles. Over the course of a typical workday with staggered arrivals, departures, and varying charge states, static allocation routinely delivers just 50-60% of the site’s potential charging throughput.
Dynamic load management (DLM) continuously monitors actual power consumption and redistributes available capacity in real-time. In our workplace example, when only three vehicles are connected at 8am, DLM allocates the full 11kW to each, using 33kW of the 70kW available and charging each vehicle at maximum speed. As more employees arrive and plug in, the system automatically reduces individual limits to stay within the site’s capacity. By 10 am, with all ten vehicles connected, each receives 7kW. When five vehicles reach 80% and reduce their acceptance to 3kW, DLM immediately reallocates that freed capacity to the remaining five vehicles, boosting them from 7kW back towards 11kW each. This continuous optimisation can increase daily charging throughput by 40-50% compared to static allocation, without any grid upgrade.
Advanced dynamic load management extends beyond the charging infrastructure to monitor the entire site’s electrical consumption. Our workplace might have a 100kW grid connection shared between 30kW of office operations (lighting, HVAC, equipment) and the 70kW nominally allocated to EV charging. During business hours, the office draws its full 30kW, leaving 70kW for vehicles. But from 6pm onwards, as lights switch off and air conditioning winds down, office consumption drops to just 5kW. Sophisticated DLM detects this and redirects the surplus 25kW to EV charging, effectively providing 95kW for the remaining vehicles – enough to charge eight vehicles at their full 11kW simultaneously.
This building-integrated approach requires energy meters at the grid connection point and communication between the building’s energy management system (EMS) and the charge point management system (CPMS). The payoff is substantial: infrastructure sized for daytime constraints can deliver significantly higher charging capacity during off-peak hours, all without upgrading the grid connection.
Smart charging
Smart charging extends beyond simple load management to incorporate external factors such as energy pricing, renewable energy availability, grid demand response signals, and individual driver preferences. While load management asks “how do we share the available power?”, smart charging asks “when and how fast should each vehicle charge to optimise outcomes for drivers, operators, and the grid?”
A smart charging system might delay or slow charging during peak electricity pricing periods, accelerate charging when solar or wind generation is high, respond to utility demand response events, or ensure a fleet vehicle reaches 80% state of charge by its scheduled departure time. The intelligence lies in balancing multiple competing objectives while respecting hard constraints like vehicle departure times, minimum charge requirements, and overall power capacity on site.
Factors impacting load balancing and smart charging
Effective charging optimisation must account for constraints at every point in the electrical chain, from the grid connection down to the vehicle’s battery management system.
Site power capacity
The grid connection represents the top-level, ultimate limit on total charging power. This capacity may be shared with other building loads (lighting, HVAC, equipment), meaning available EV charging capacity fluctuates throughout the day. Advanced systems integrate with building energy management systems to dynamically allocate surplus capacity to EV charging while protecting critical loads, as mentioned above.
Solar power generation
On-site generation, in particular solar PV, adds another variable to load management calculations. When solar panels generate power, that energy can offset grid consumption, effectively increasing the capacity available for EV charging. Dynamic systems can prioritise charging during peak solar production, maximising the use of free, zero-carbon energy. This solar-aware charging becomes increasingly important as sites deploy larger PV arrays and seek to minimise both energy costs and carbon footprint.
Charger power rating
Each charging station has a maximum power output, typically 7.4kW, 11kW, or 22kW for AC chargers, and 50kW to 400kW for DC fast and HPC (High Power Charger) chargers – aka Rapid and Ultra-Rapid chargers in the UK. The charger’s rated power represents an upper bound; actual delivered power will be the minimum of the charger’s capability, the cable capacity, and the vehicle’s acceptance rate.
Power cable capabilities
Charging cables have current-carrying limits based on their conductor cross-section. Type 2 cables are rated for different maximum currents (typically 16A, 32A, or 63A per phase). The cable’s proximity pilot (PP, more details on plug pins here) resistor communicates its rating to the charger, which must respect this limit regardless of the charger’s own capability.
For DC fast charging, cables are typically rated for 200A to 500A, with newer high-power charging (HPC) installations supporting up to 500A at voltages up to 1000V for charging rates exceeding 400kW. DC cables are liquid-cooled at these higher ratings to manage heat dissipation within a manageable cable diameter and weight.
EV battery and on-board charger limits
Every electric vehicle contains an on-board charger (OBC) that converts AC power to DC for battery charging. The OBC’s power rating and phase support determine the vehicle’s maximum AC charging rate. A vehicle with a 7.4kW single-phase OBC cannot benefit from connecting to a 22kW three-phase charger; it will draw only what its OBC can handle. (We’ll get to the concept of ‘phases’ in a minute)
Battery management systems (BMS) further modulate charging rates based on temperature, state of charge (SOC), and battery cell health. Most lithium-ion batteries charge most efficiently in the 20–40°C range; below this, chemical reactions slow and the BMS reduces charging current to prevent lithium plating, while above this range, charging is throttled to prevent thermal degradation.
Charging typically slows significantly above 80% SOC to protect battery longevity. Think of it like filling a bathtub: you can run the tap at full blast when the tub is empty, but as the water level rises toward the rim, you need to reduce the flow to avoid overflow. Similarly, the BMS reduces charging current as the battery approaches full capacity to prevent overcharging individual cells, which could cause irreversible damage or safety hazards.
AC wiring and phase configuration
Three-phase AC power is the standard for commercial and industrial electrical installations across Europe. Unlike single-phase power (which uses one live wire plus neutral), three-phase power delivers electricity through three live wires, commonly labelled L1, L2, and L3 (or sometimes R, S, T in older notation). Each wire carries current that peaks at a different time, 120 degrees apart, creating a smoother and more efficient power delivery.
If you want to understand the concept behind three-phase electricity in more detail, then I highly recommend this great explainer video from The Engineering Mindset:
In a typical EV charging installation, power flows from the grid through a distribution board (sometimes called a feeder pillar) to individual chargers. Each charger receives a five-core cable containing:
L1 (Line 1 / Phase 1)
L2 (Line 2 / Phase 2)
L3 (Line 3 / Phase 3)
N (Neutral)
PE (Protective Earth / Ground)
The charger’s internal wiring connects these incoming lines to its charging socket. When a vehicle plugs in, it draws power from one or more of these phases depending on its on-board charger’s capability.
Crucially, each phase has its own protection (circuit breaker or fuse) in the distribution board. If a charger draws 32A on L1 while L2 and L3 are lightly loaded, the L1 circuit breaker could trip even though the total site capacity isn’t exhausted. This is why load management must protect and balance each phase individually, not just monitor total power.
Phase rotation for AC charging
Phase rotation is a critical but often overlooked aspect of multi-charger installations. Understanding and properly implementing phase rotation can dramatically improve charging efficiency and prevent load imbalances.
The challenge: single-phase vehicles on three-phase infrastructure
Here’s the problem: many EVs – particularly plug-in hybrids and smaller-battery EVs like the Nissan Leaf, Hyundai Kona (base model), or Jaguar I-PACE – have single-phase on-board chargers. These vehicles can only draw power from one phase, typically L1, regardless of how many phases the charger or installation supports.
Think of it like a three-lane motorway where certain vehicles can only drive in the left lane. If all vehicles are restricted to the left lane, you get congestion there while the middle and right lanes sit empty.
When multiple single-phase vehicles charge simultaneously on chargers with identical phase wiring, all the load concentrates on L1. The result? An unbalanced electrical installation where one phase is overloaded while the others are underutilised.
A concrete example: four chargers, four single-phase EVs
Consider a charging site with:
4 bay × 2 socket chargers (4 charge points total)
22kW chargers rated at 32A per phase
69kVA with 100A site capacity (shared across all phases)
Four 7kW single-phase vehicles connected (each drawing 32A from L1 only)
Scenario 1: No phase rotation
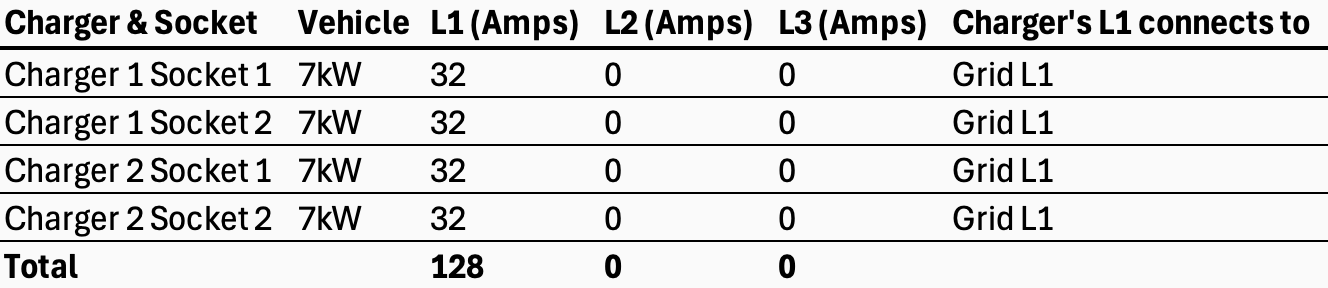
Result: 128A on L1 exceeds the 100A site limit. The L1 circuit breaker trips, or load management must aggressively curtail all charging (e.g. to 16A instead of 32A), even though L2 and L3 have zero load.
Scenario 2: Phase rotation to charger
By rotating the phase connections at each charger, the electrician connects different chargers' L1 input to different grid phases:
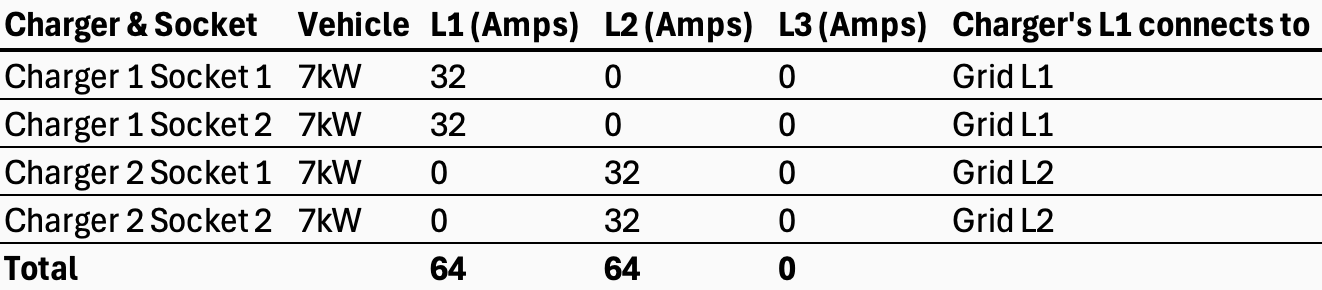
Result: 64A on L1 and 64A on L2, both well under the 100A limit. However, L3 is still unused (unbalanced). Unbalanced phases can lead to increased power losses, increased neutral conductor current, and reduced equipment lifespan.
Germany’s VDE-AR-N 4100 regulation, for example, explicitly limits phase imbalance to a maximum of 4.6 kVA (approx. 20 A) – meaning EV charging operators must actively manage load distribution across phases to remain compliant and avoid grid connection issues.
The UK takes a less prescriptive approach: BS 7671 addresses phase balance primarily in the context of earthing safety rather than grid stability, and DNOs manage network-level balance through their own operational practices rather than imposing specific kVA limits on individual charging installations.
Scenario 3: Phase rotation between sockets and to charger
Some charger manufacturers offer phase rotation between the two sockets on a dual-socket charger. Combined with rotation at the charger level:
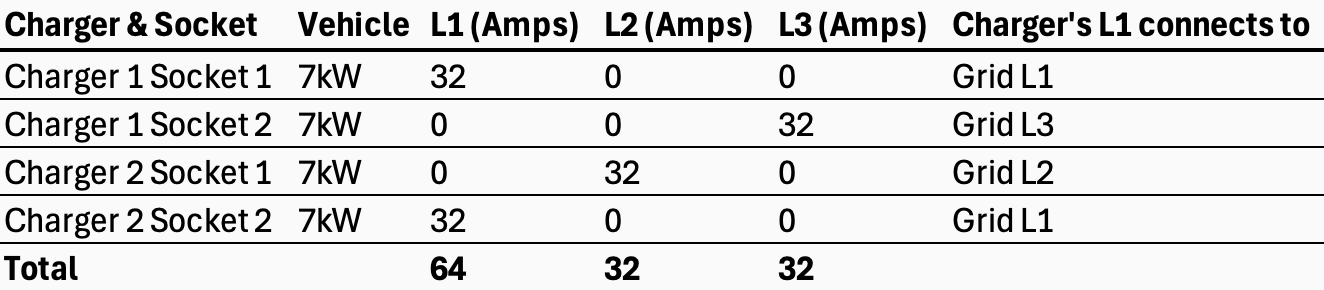
Result: Load is distributed across all three phases (64A, 32A, 32A), now much more balanced than scenario 1’s 128A on a single phase. All vehicles charge at full speed without exceeding any phase limit.
However, this still leaves a 32A difference between L1 and the other phases. In Germany, where VDE-AR-N 4100 limits phase imbalance to 4.6 kVA (approximately 20A at 230V), this configuration alone wouldn't be compliant. Dynamic load management would need to actively curtail charging current on the more heavily loaded phase to bring the imbalance within the permitted limit, thereby trading some charging speed for regulatory compliance.
How phase rotation works in practice
When an electrician installs a three-phase charger, they connect the incoming five-core cable to the charger’s internal connection points (often labelled L1, L2, L3, N, PE on a terminal block inside the charger). In a standard installation, they match the cable’s phases to the charger’s labels: Grid L1 → Charger L1, Grid L2 → Charger L2, Grid L3 → Charger L3.
To implement phase rotation, they deliberately mismatch these connections:
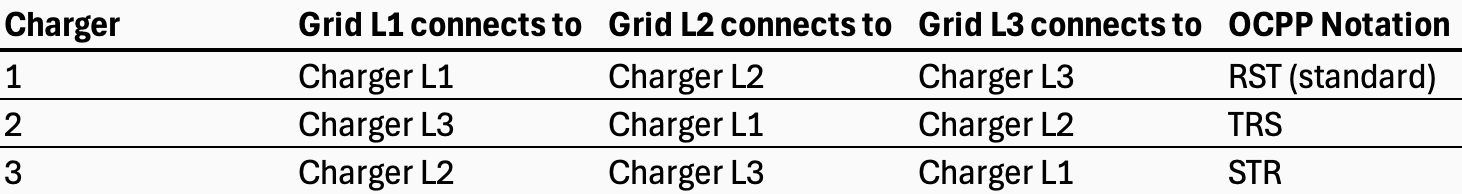
Now, when a single-phase vehicle connects to Charger 2 and draws from "L1" (from the charger's perspective), it's actually drawing from Grid L3. The load is spread across all three grid phases.
Phase rotation notation in OCPP
The Open Charge Point Protocol (OCPP) defines phase rotation using a three-letter code describing how grid phases R (L1), S (L2), and T (L3) map to the charger’s connector. The possible values are:
RST: Standard reference phasing (Grid L1→Charger L1, L2→L2, L3→L3)
RTS: Grid L1→Charger L1, Grid L2→Charger L3, Grid L3→Charger L2
SRT: Grid L1→Charger L2, Grid L2→Charger L1, Grid L3→Charger L3
STR: Grid L1→Charger L2, Grid L2→Charger L3, Grid L3→Charger L1
TRS: Grid L1→Charger L3, Grid L2→Charger L1, Grid L3→Charger L2
TSR: Grid L1→Charger L3, Grid L2→Charger L2, Grid L3→Charger L1
NotApplicable: Single-phase or DC charge points
Unknown: Phase rotation not yet determined
The ConnectorPhaseRotation configuration key (OCPP 1.6) and PhaseRotation variable (OCPP 2.0.1 device model) reports this information to the CPMS, allowing smarter load management that accounts for actual phase distribution.
Why this matters for load management systems
Here’s the critical point: the load management system must know each charger’s phase rotation to function correctly.
When a charger reports it’s drawing 32A on “L1”, the CPMS needs to know whether that’s actually Grid L1, L2, or L3. If the system assumes standard RST rotation when the charger is wired as TRS, all its phase balancing calculations will be wrong.
Some chargers don’t offer phase rotation between sockets, meaning both sockets share the same phase mapping. Others rotate between sockets, with L1 and L3 swapped between the two sockets on a single unit. This affects both installation planning and load management configuration.
Critical considerations and best practices
Phase switching during charging: Some charging profiles may include switching between single-phase and three-phase charging during a session. This is dangerous as not all EVs support mid-session phase changes, and attempting this can cause physical damage to the vehicle’s on-board charger. The OCPP 1.6 configuration key ConnectorSwitch3to1PhaseSupported indicates whether a charger supports this capability. Operators should exercise extreme caution with phase switching features.
Documentation and commissioning: Accurate phase rotation configuration is essential for load management systems to function correctly. If the CPMS believes a charger uses standard RST rotation when it’s actually wired as TRS, phase-aware load balancing calculations will be wrong. Document all phase rotations during installation and verify they’re correctly configured in the management system. Some charger manufacturers offer internal phase rotation between sockets, others don't. Factor this into your planning.
Monitor and verify during operation: After installation, use phase-level metering to confirm loads are distributed as expected.
OCPP 1.6: The foundation of smart charging
Open Charge Point Protocol (OCPP) 1.6, released in 2015, established the smart charging framework that remains widely deployed today. Understanding its capabilities and limitations is essential for anyone working with charging infrastructure.
Charging profiles: the core concept
A charging profile is essentially a schedule of power or current limits over time. Each profile contains a ChargingSchedule – a sequence of periods, each specifying a limit (in watts or amps) and its duration. The charge point applies these limits by either modulating the control pilot signal that communicates maximum current to the vehicle – in case of analogue AC charging based solely on the IEC 61851 standard – or by translating the schedule into an ISO 15118-equivalent data structure if the EV communicates with the (AC or DC) charger using IP-based, digital communication. We'll explore how OCPP and ISO 15118 work together to enable smart charging in one of my next articles.
OCPP 1.6 defines three profile purposes, each serving a distinct use case:
ChargePointMaxProfile: Sets limits for the entire charge point, shared across all its connectors. This profile represents hard infrastructure constraints like site’s grid connection or distribution panel capacity. It can only be applied to ConnectorId 0 (meaning “all connectors” or sockets). Think of this as the site-level constraint: no matter how individual sessions are scheduled, total power cannot exceed this limit.
TxDefaultProfile: Defines default charging schedules that apply to new transactions. These profiles implement charging policies. For example, preventing high-power charging during peak electricity pricing periods, or defining “night mode” that allows full power only between 10 PM and 6 AM. TxDefaultProfile can apply to all connectors (ConnectorId 0) or to a specific connector.
TxProfile: Transaction-specific profiles that override TxDefaultProfile for a particular charging session. The CPMS sends these during or at the start of a transaction to implement real-time smart charging decisions. When the transaction ends, the TxProfile is deleted. This enables per-session optimisation based on vehicle energy needs, driver preferences like departure time, or grid conditions.
Profile stacking and the composite schedule
Multiple profiles of the same purpose can coexist using the stackLevel parameter. Higher stackLevel profiles take precedence, which is useful for creating complex calendars with base schedules and exception overlays (holidays, special events, etc.).
The charge point calculates a Composite Schedule by combining the active ChargePointMaxProfile with either the TxProfile (if one exists for the transaction) or the applicable TxDefaultProfile. At each moment, the applied limit is the minimum of all relevant limits. This ensures infrastructure constraints are always respected while allowing flexibility in individual session management.
Smart charging use cases in OCPP 1.6
The specification describes three typical smart charging architectures:
Internal load balancing: The charge point itself manages load distribution across its connectors without involvement from a cloud-based backend, or CPMS. A ChargePointMaxProfile defines the total allowed power, and the charge point internally distributes this among active sessions. This works well for simple installations where per-session optimisation isn’t required.
Central smart charging: The central system (aka CPMS) calculates and sends charging profiles based on external information like grid capacity forecasts from the distribution system operator (DSO), energy prices, renewable generation availability, or fleet scheduling requirements. TxProfile messages allow the CPMS to adjust limits dynamically throughout each session.
Local smart charging: A local controller manages a group of charge points at a site, distributing available capacity among them. The local controller communicates with the CPMS using standard OCPP and acts as a proxy for the charge points it manages. This architecture suits parking garages or fleet depots where local responsiveness with minimal latency is important but central visibility is still required.
Local controllers are particularly important for sites with unreliable internet connectivity or where sub-second response times are required to prevent fuse trips or to provide time-critical grid services like frequency containment reserve (a topic we’ll explore in future articles). Many operators deploy hybrid architectures: a local gateway handles time-critical load balancing decisions while the cloud-based CPMS manages business logic, reporting, and optimisation across multiple sites.
OCPP 1.6 laid the groundwork for smart charging, but it has limitations.
You might have noticed that everything we've covered so far treats the vehicle as a passive load whereby the charging station makes all the decisions. But what if the vehicle could tell the network exactly what it needs, when it needs it, and how flexible it can be? That's where ISO 15118 and OCPP 2.0.1 come in, and we'll unpack how they work together in the next article.
I'm curious: have you encountered load management challenges at your site, whether at work or a public charging location? What worked, and what didn't? Let me know in the comments.